Sample project · Collected listings plotted by category
Restaurants · 34
Cafés · 22
Retail · 26
Overview
Map listings, turned into an analysis-ready dataset
Map platforms hold the most complete public record of where businesses actually are: their category, their address, their coordinates, how people rate them and when they are open. That record is designed to be browsed one listing at a time, which makes it almost useless for analysis at city or country scale.
We turn that record into a table. You define the geography and the categories you care about; we return one row per business with consistent field names, validated coordinates and a clear note on which fields were unavailable rather than silently blank.
Coverage is defined by a search geometry rather than a keyword, so a request for restaurants in Greater Boston is systematically tiled across the metro area instead of returning whatever the first page of results happened to show.
Real output
How we prove a collection is complete
Two checks we run on every listings project, shown here on an open dataset of 8,628 Manhattan businesses. A record count on its own tells you nothing about whether the collection actually finished.
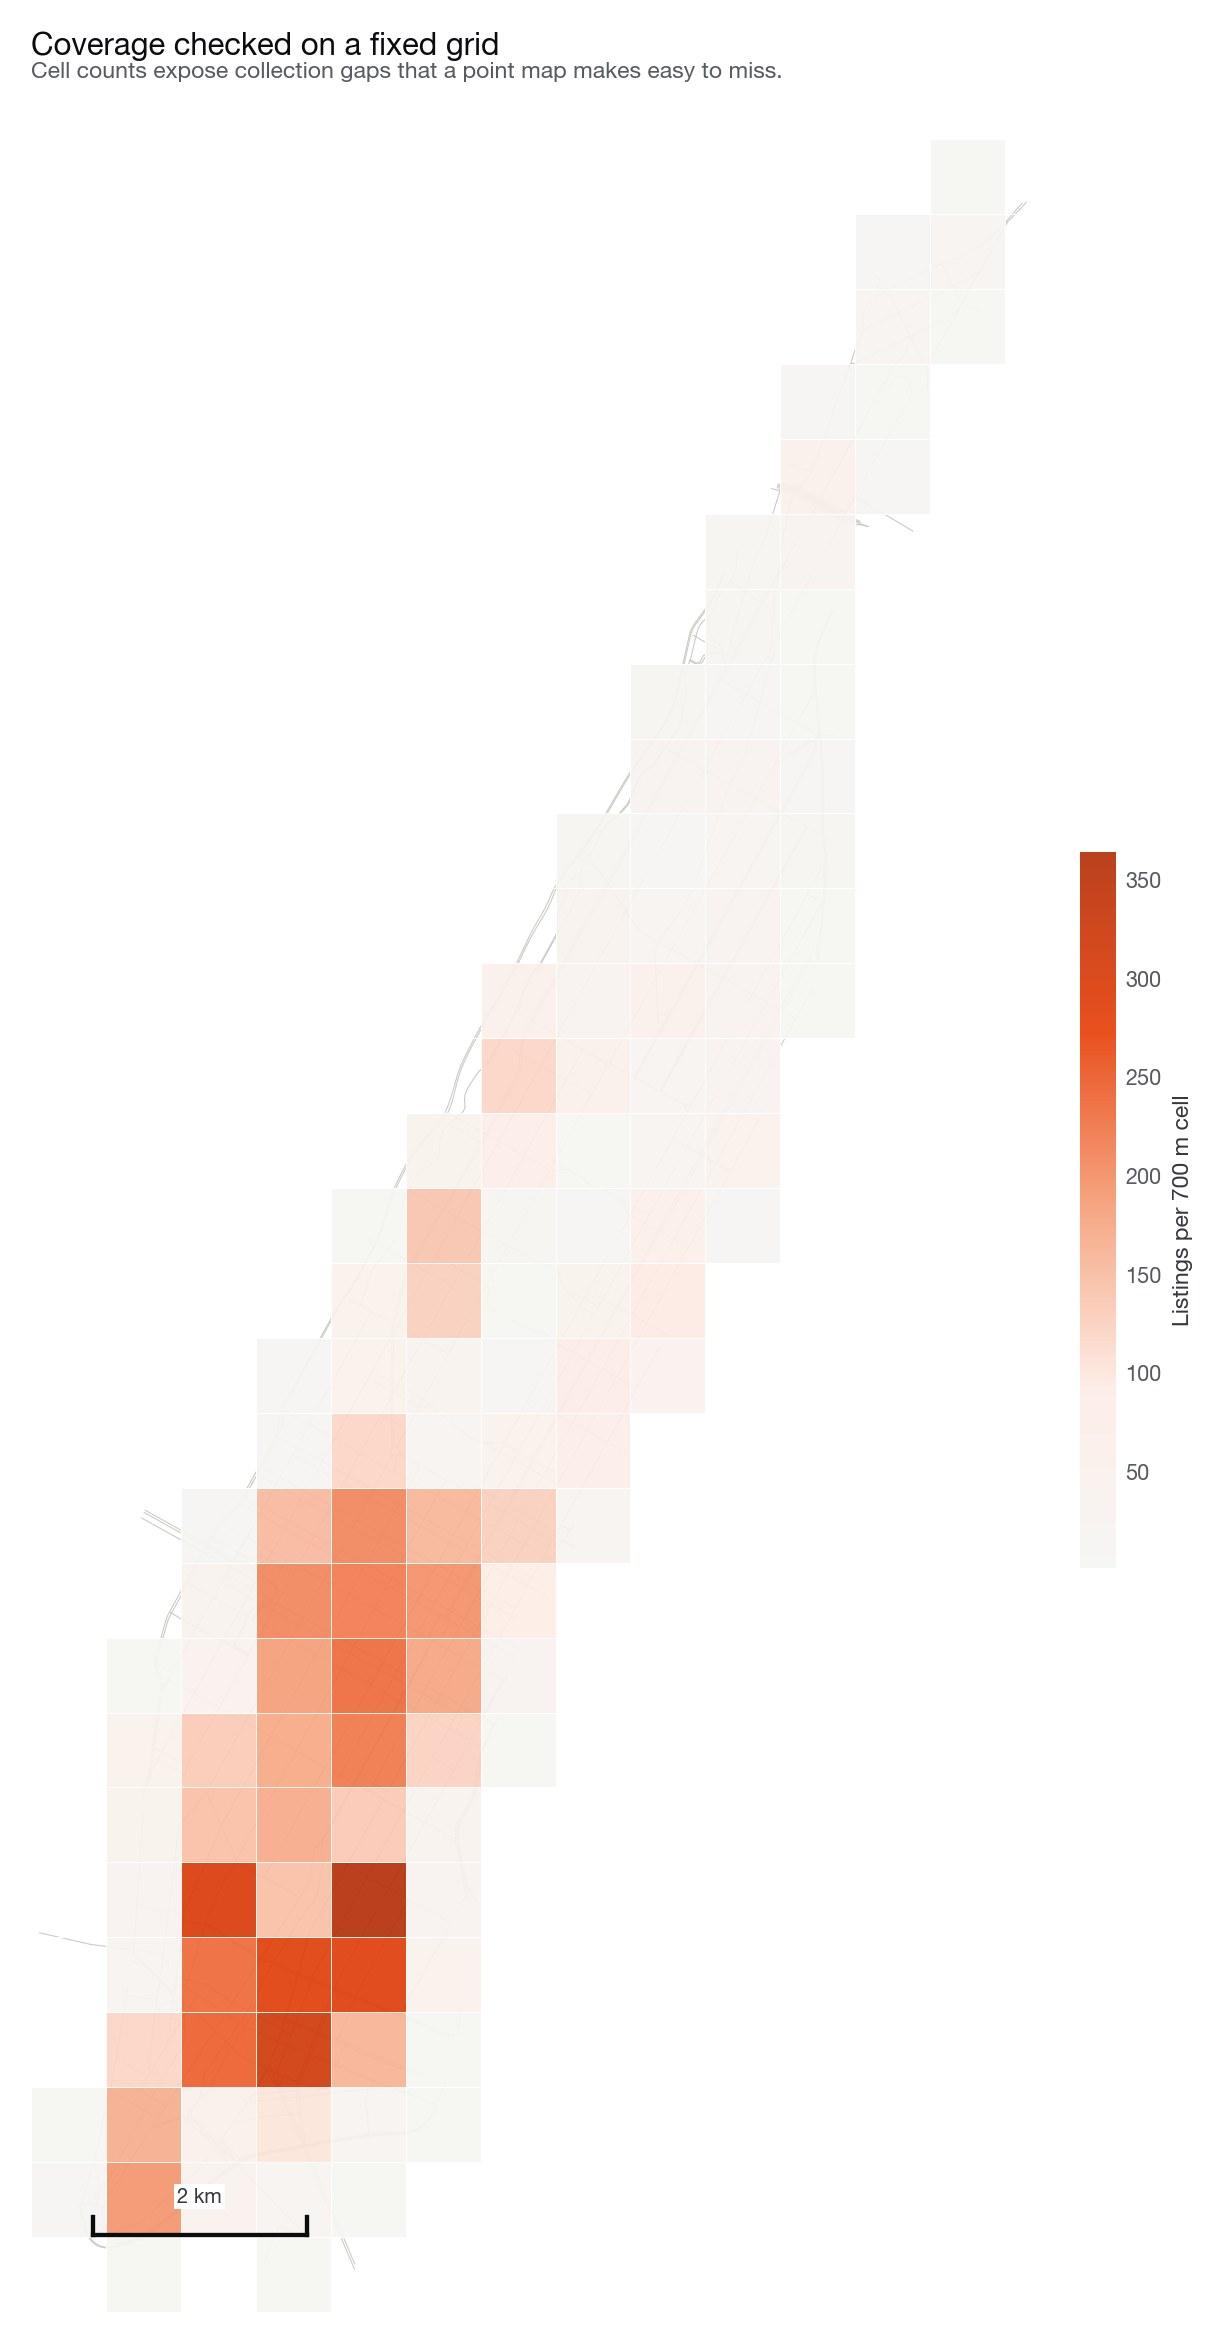
Coverage checked cell by cell
The area is divided into fixed 700 m cells and listings are counted in each one. A run that stopped early, a district that silently returned nothing, or a query that hit a result cap all show up here as cells that are empty when the streets around them are not.
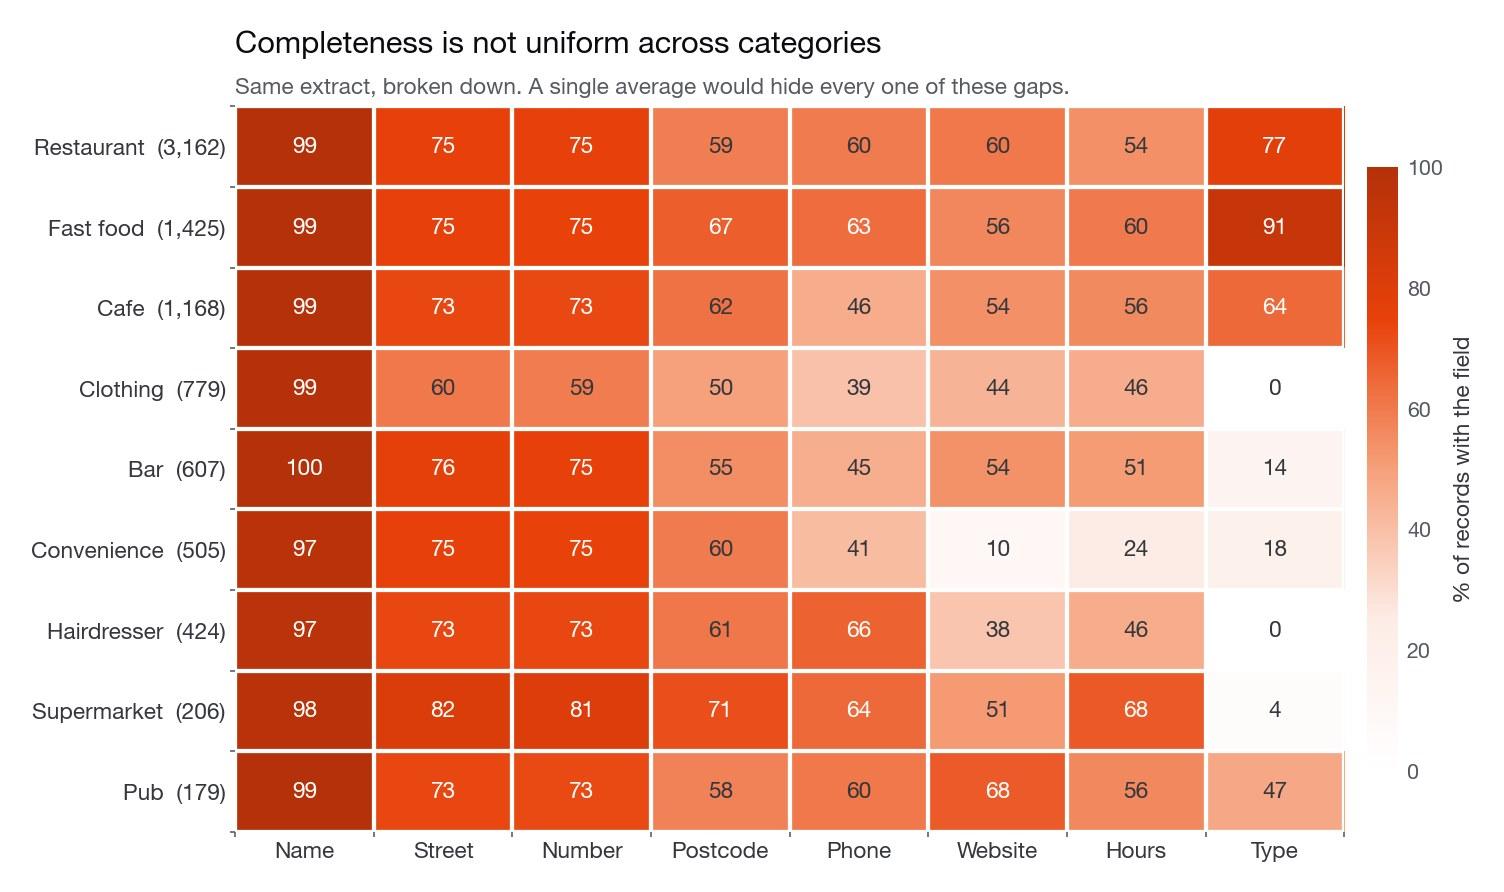
Field completeness, broken down by category
The same extract, category by category. Names are near-universal; opening hours, websites and phone numbers are not, and how far they fall varies by category. This is the difference between a dataset you can plan around and one that surprises you halfway through.
Sample project data. Values illustrate the schema and formatting we deliver; they are not a real client dataset.
Sample project · Restaurant listings, Boston MA · 12 fields shown as 6
Business name
Category
City
Latitude
Longitude
Rating
Reviews
North End Trattoria
Italian restaurant
Boston
42.36372
-71.05489
4.6
1,284
Harbor Oyster House
Seafood restaurant
Boston
42.35921
-71.05114
4.4
2,031
Cambridge Coffee Lab
Coffee shop
Cambridge
42.37512
-71.11803
4.7
846
Fenway Taqueria
Mexican restaurant
Boston
42.34617
-71.09724
4.3
612
Somerville Bakehouse
Bakery
Somerville
42.39554
-71.10023
4.8
398
Seaport Ramen Bar
Ramen restaurant
Boston
42.35198
-71.04406
4.5
1,147
Delivered work
This service on a real project
Sample projects built on this service, with the numbers they produced and what each one settled.
POI DataLocation IntelligenceHeatmap Analysis
Restaurant Location Intelligence
Mapping a city's food and drink offer, measuring competitive density, and producing a ranked shortlist of neighbourhoods for a new venue.
Venues collected
3,180
Coverage recovered
+6%
Areas shortlisted
42 → 6
What it showed
Market Square, the area the operator had assumed was strongest because it felt busy, had the highest competitive density in the city and the highest incumbent ratings. Entering there would have meant competing with well-established venues for demand that was already fully served.
Riverside North had a third of the competitive density with over half the reachable demand of Market Square. It scored highest overall despite feeling quieter on a weekend visit, because much of its demand is workplace-based and shows up on weekdays.
Building a comparable category census across five metro areas, and the standardisation work that made the comparison valid.
Raw records
94,200
Unique POIs
71,480
Category labels
14 → 1
What it showed
Ranked by absolute count, Metro A led by a wide margin. Ranked per capita, it placed third, and the two markets the team had considered marginal turned out to be the most densely served.
Chain share varied from 17.9% to 51.4% across markets that industry commentary had treated as broadly similar. That spread became the central finding of the research rather than a footnote.
Share the categories, the geography and the fields that matter for your decision.
Step 02
We define the data scope
We translate that into a search geometry, a field list and a delivery schema, then confirm it with you.
Step 03
We collect and process the data
Coverage is tiled across the area, records are deduplicated and addresses are parsed into components.
Step 04
We validate the dataset
Coordinates, categories and completeness are checked, and we report what could not be found.
Step 05
We deliver the final result
You receive the dataset in your chosen formats with a field dictionary and a coverage summary.
Pricing scales with the number of records, the number of geographies, the field list and the refresh frequency. Tell us the cities and categories you need and you get a fixed price before collection starts.
FAQ
Questions we get asked
What type of data can you collect?
Publicly visible listing attributes: business name, category, address, coordinates, phone, website, rating, review count, opening hours, price level and closure status. If a field is not published for a listing, it is returned empty rather than guessed.
Can you collect data for a specific city?
Yes. Scope can be a city, a metro area, a postcode list, a radius around a point, a drive-time isochrone or a custom polygon you supply as GeoJSON or Shapefile. We tile the search across that geometry so coverage is even rather than concentrated in the centre.
What formats can you deliver?
CSV, Excel, JSON, GeoJSON and Shapefile as standard. We can also load results directly into PostgreSQL/PostGIS, BigQuery or an S3 bucket you control.
How long does data collection take?
A single city in one category is typically ready in two to four business days. Multi-city or multi-category projects usually run one to two weeks. You get a sample of a few hundred records early so the schema can be corrected before the full run.
Can you provide recurring data collection?
Yes. Weekly, monthly or quarterly refreshes are common. Each refresh includes a change log of added, removed and modified listings so you can measure openings, closures and rating movement over time.
How accurate are the coordinates?
Coordinates come from the listing itself and are validated against the stated address. Records where the two disagree beyond a tolerance are flagged in a separate column so you can decide whether to keep, re-geocode or exclude them.
Is this legal?
We work only with publicly available information, respect the access limits of the sources we use, and decline projects that require circumventing authentication or platform protections. For anything sensitive we recommend an official API or a licensed data provider, and we will tell you when that is the better route.
Tell us the geography, the fields and the cadence you need for google maps data. You get a scoped plan, a sample and a fixed price before any work starts.