Skip to content

Point of interest data

POI Data Services

Business and point-of-interest data with geographic coordinates, consistent categories and documented coverage.

Sample project · POI layer by standardised category
  • Restaurants · 34
  • Cafés · 22
  • Retail · 26

Overview

A POI dataset is only as good as its category scheme

Points of interest are simple on the surface: a name, a coordinate, a category. The difficulty is consistency. One source calls a venue a “cafe”, another “coffee shop”, a third “restaurant”. Count them naively and your market size moves by a third depending on which label you trusted.

We standardise categories into a scheme you can defend, keep the original source label in its own column, and document exactly how the mapping was made. Nothing is silently reclassified.

The same discipline applies to duplicates. The same venue appearing in two sources is resolved with normalised name matching plus a distance threshold, and the merge rules are written down rather than buried in a script.

Real output

A real extract, mapped and measured

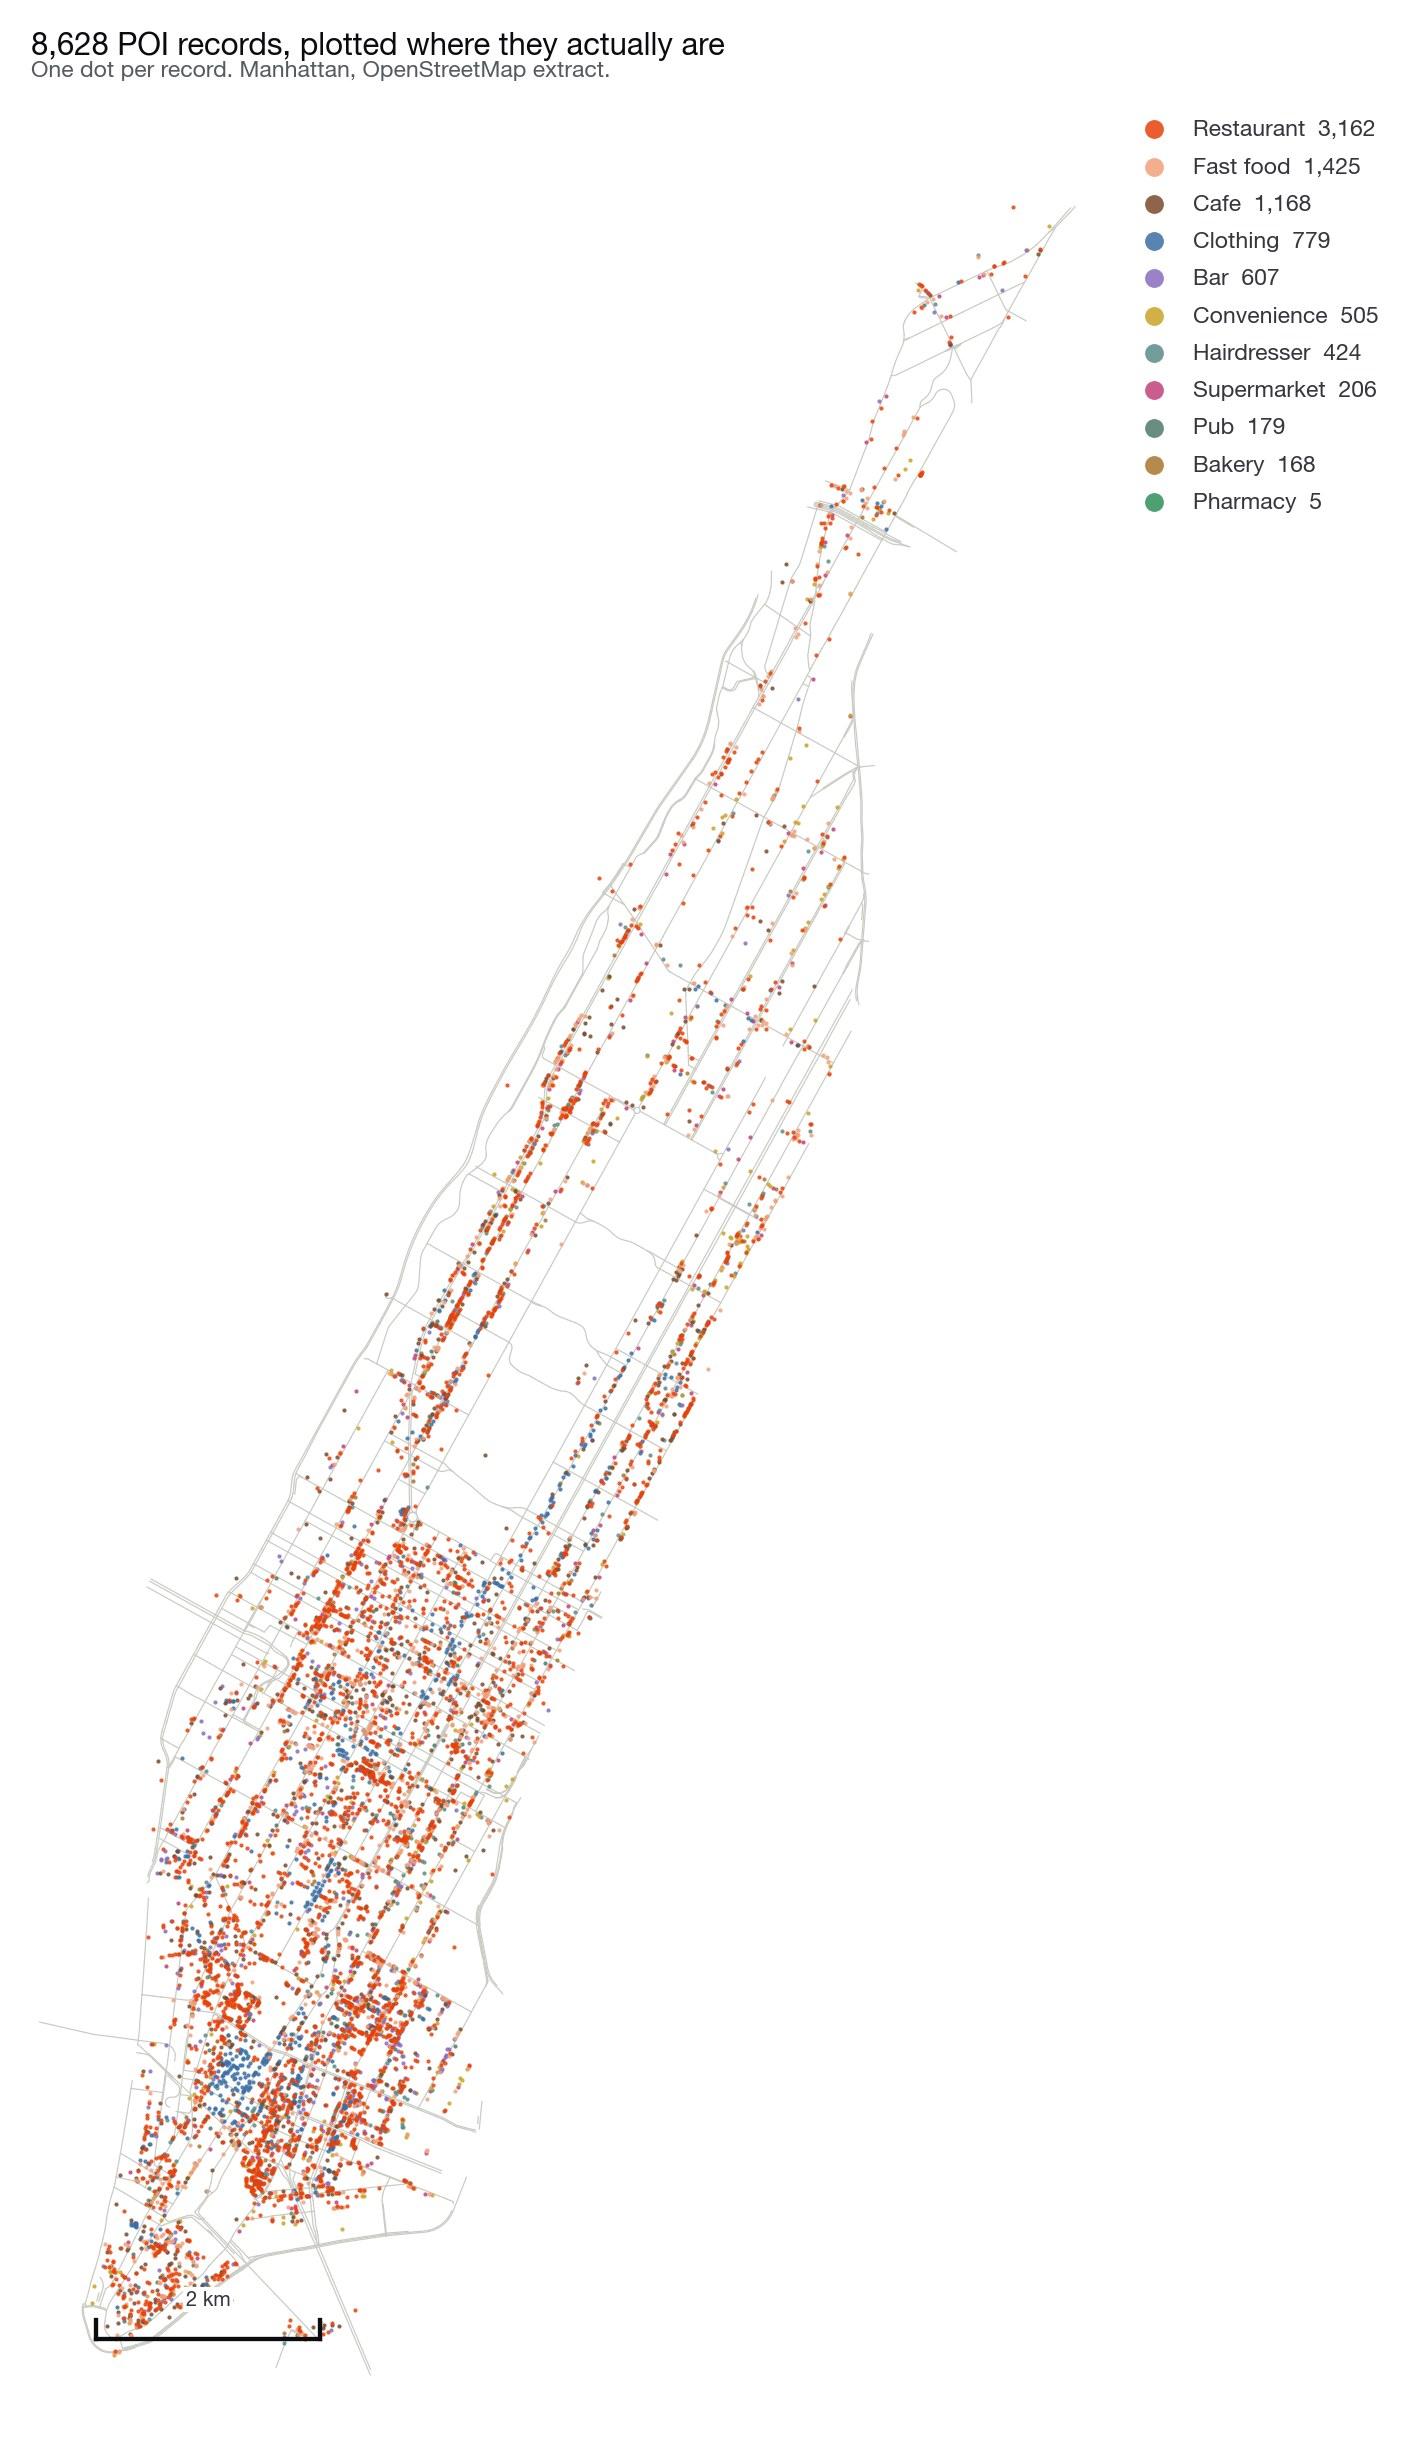
8,628 POI records across Manhattan, taken from a single OpenStreetMap extract and put through the same steps a delivered dataset goes through. The point is not the map; it is that every claim below can be checked against the data.

Every record, where it actually is

One dot per record, coloured by category, with the street network underneath for reference. Plotting the whole extract rather than a sample is the first honest check on a POI dataset: gaps, duplicates and misplaced coordinates all become visible at this zoom.

Map of Manhattan showing 8,628 POI records as coloured dots by category, over the street network

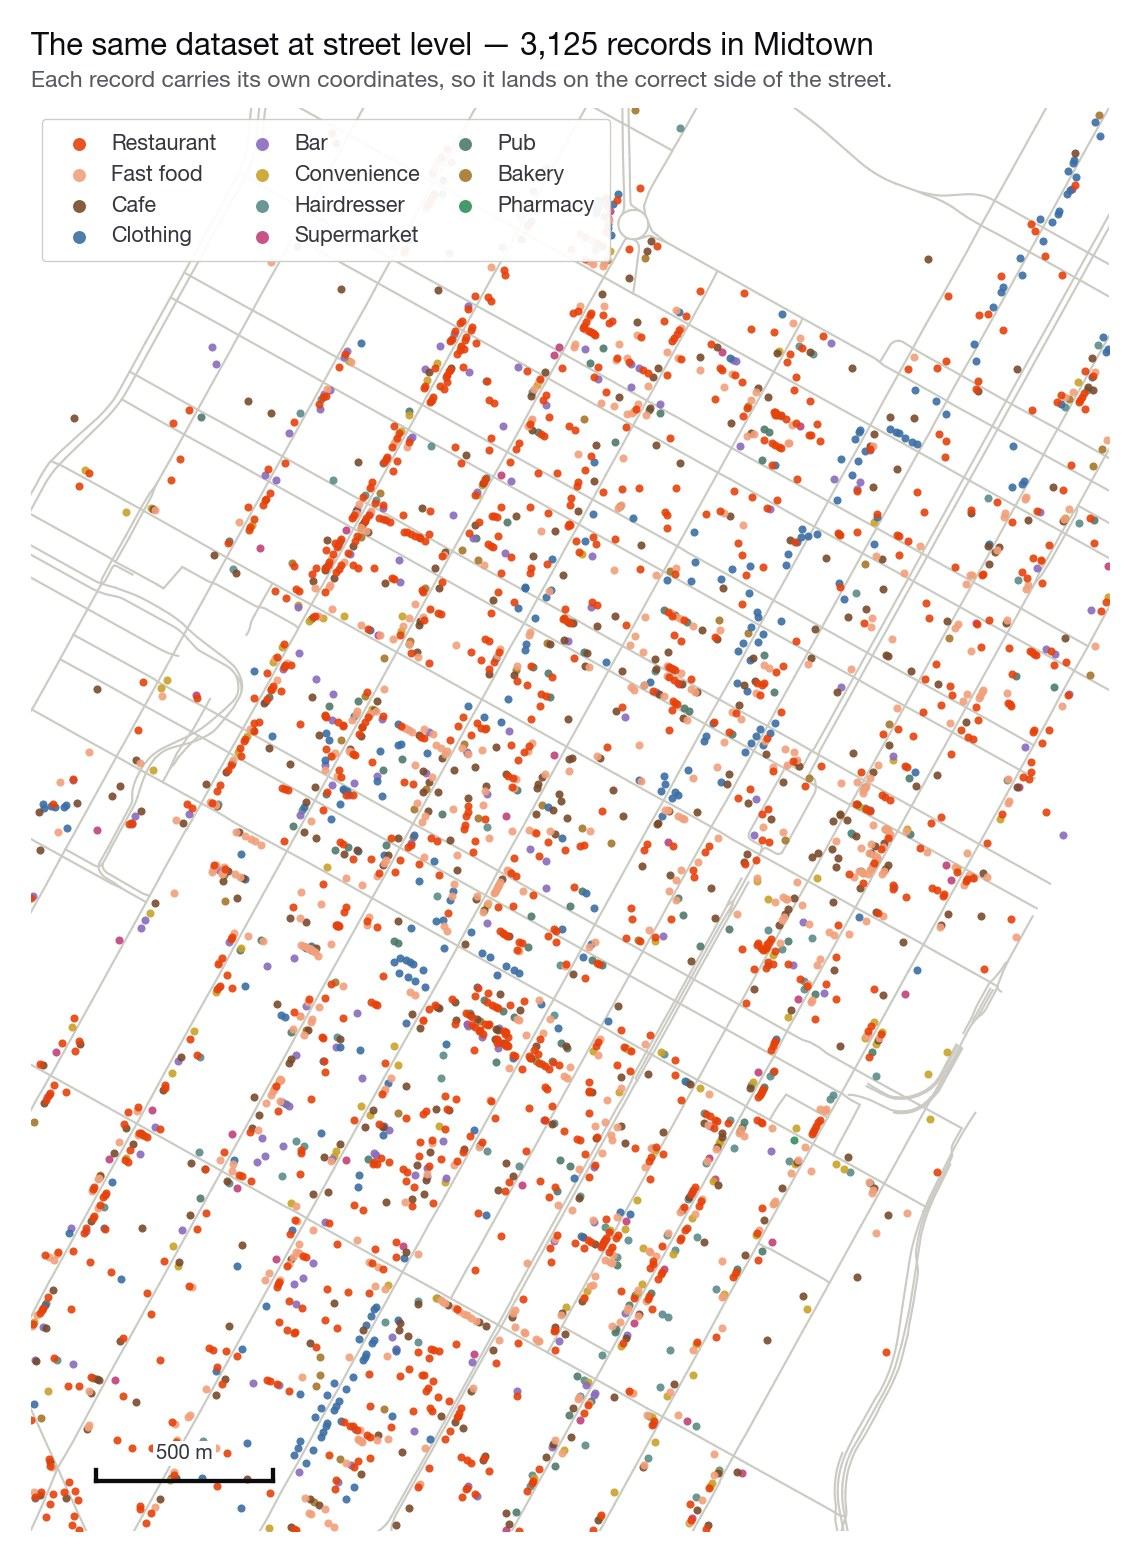
The same data at street level

Zoomed to Midtown, where 3,125 of those records sit. Coordinates are precise enough that records land on the correct side of the street, which is what makes catchment and frontage analysis possible later.

Street-level zoom of Midtown Manhattan showing individual POI records along each street, coloured by category

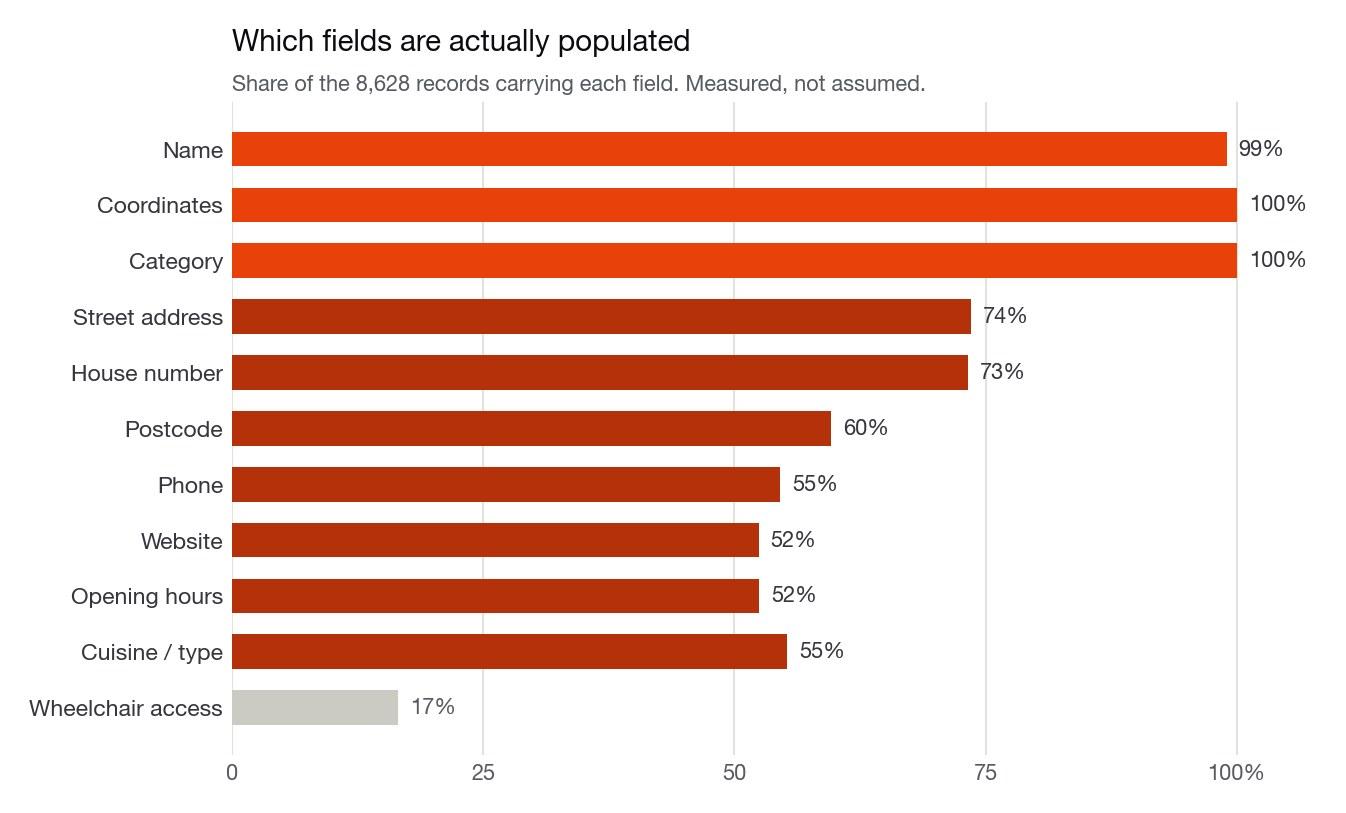
How complete each field really is

Measured across all 8,628 records rather than estimated. Name, coordinates and category are effectively universal; phone, website and opening hours sit near half. We report this per project so you know what you can build on before you build on it.

Bar chart of field completeness across POI records, from name and coordinates at 99-100% down to wheelchair access at 17%

Data © OpenStreetMap contributors, available under the Open Database Licence. Used here as a public dataset we can show openly; client work runs on the sources agreed for that project.

Scope

What a POI record contains

A standard record. Additional attributes can be added where the source publishes them.

  • POI identifier

    A stable key that survives refreshes, so you can track a venue over time.

  • Name

    Published name, plus a normalised form used for matching.

  • Standardised category

    Mapped to an agreed scheme, with the original source label retained alongside it.

  • Coordinates

    Latitude and longitude in WGS 84, validated against the address.

  • Address components

    Street, city, region, postcode and country, parsed rather than left as one string.

  • Contact details

    Business phone and website where published by the business.

  • Opening hours

    Weekly schedule in a structured form, including seasonal and closed-day handling.

  • Popularity signals

    Rating and review counts where published, useful as a demand proxy.

  • Status

    Open, temporarily closed or permanently closed, so counts stay honest.

  • Brand and chain flag

    Whether a venue belongs to a chain, and which one, for competitive analysis.

  • Administrative joins

    Census tract, postcode area or custom zone identifiers, pre-joined for aggregation.

  • Collection date

    When the record was captured, so freshness is never in question.

Output formats

Delivered the way your stack expects

CSV
One row per POI, with coordinates as decimal degrees.
Excel
Workbook with data, category mapping and coverage sheets.
JSON
Nested records preserving hours, categories and attribute arrays.
GeoJSON
Point features in EPSG:4326 for web maps and GIS software.
Shapefile
Point shapefile with projection metadata for ArcGIS workflows.

Sample dataset

What you actually receive

Sample project data. The source label stays in the dataset so any category decision can be audited or reversed.

Sample project · POI dataset · standardised categories
POI IDNameStandard categorySource labelLatitudeLongitudeStatus
POI-8841021Kirkwood CoffeeCafeCoffee shop33.75121-84.31688Open
POI-8841022Grant Park GrocersGrocerySupermarket33.73894-84.36002Open
POI-8841023Edgewood Pizza Co.Restaurant · PizzaPizza restaurant33.75630-84.34199Open
POI-8841024Old Fourth Ward GymFitnessGym33.76412-84.36871Temporarily closed
POI-8841025Inman Park BakeryBakeryBakery33.76187-84.35364Open
POI-8841026Reynoldstown BarBarCocktail bar33.75208-84.34617Open

Delivered work

This service on a real project

Sample projects built on this service, with the numbers they produced and what each one settled.

POI DataData CollectionMarket Research

POI Data Analysis

Building a comparable category census across five metro areas, and the standardisation work that made the comparison valid.

Raw records
94,200
Unique POIs
71,480
Category labels
14 → 1

What it showed

  • Ranked by absolute count, Metro A led by a wide margin. Ranked per capita, it placed third, and the two markets the team had considered marginal turned out to be the most densely served.
  • Chain share varied from 17.9% to 51.4% across markets that industry commentary had treated as broadly similar. That spread became the central finding of the research rather than a footnote.
Read the full case study
POI DataLocation IntelligenceHeatmap Analysis

Restaurant Location Intelligence

Mapping a city's food and drink offer, measuring competitive density, and producing a ranked shortlist of neighbourhoods for a new venue.

Venues collected
3,180
Coverage recovered
+6%
Areas shortlisted
42 → 6

What it showed

  • Market Square, the area the operator had assumed was strongest because it felt busy, had the highest competitive density in the city and the highest incumbent ratings. Entering there would have meant competing with well-established venues for demand that was already fully served.
  • Riverside North had a third of the competitive density with over half the reachable demand of Market Square. It scored highest overall despite feeling quieter on a weekend visit, because much of its demand is workplace-based and shows up on weekdays.
Read the full case study

How it works

Five steps, every project

  1. Step 01

    Tell us what data you need

    Which categories, which geography, and what the counts will be used for.

  2. Step 02

    We define the data scope

    We agree the category scheme, the field list and how chains and duplicates are treated.

  3. Step 03

    We collect and process the data

    Sources are collected, addresses parsed, coordinates validated and categories mapped.

  4. Step 04

    We validate the dataset

    Duplicate rate, category coverage and spatial distribution are checked against expectations.

  5. Step 05

    We deliver the final result

    POI layer plus category mapping table, coverage summary and collection dates.

Quoted on volume, the number of categories and cities, and the refresh cadence if the dataset is a recurring one. Tell us the coverage you need and you get a fixed price against a written scope.

FAQ

Questions we get asked

What is POI data?

POI stands for point of interest: a specific place recorded as a coordinate with attributes, such as a restaurant, pharmacy, ATM, school or transit stop. In practice a POI dataset is a table of places with a name, a category, a location and whatever attributes the source publishes.

How many POIs can you collect for a city?

It depends on the categories. A single category in a mid-sized metro is typically a few thousand records; a broad multi-category sweep of a large metro runs into the tens of thousands. We give you a count estimate from a pilot area before the full run.

How do you handle duplicate venues?

With a documented rule set: names are normalised, then candidate matches within a distance threshold are compared on address and category. Merges keep the most complete record and retain the alternate source identifiers so nothing is lost.

Can you use our own category scheme?

Yes. If you supply a taxonomy we map to it and deliver the mapping table so you can audit every decision. If you do not have one, we propose a scheme based on how you intend to aggregate the data.

How fresh is the data?

Every record carries a collection date. For a one-off delivery, the data is as fresh as the run. For monitored categories, weekly or monthly refreshes keep status changes such as closures current, with a change log per run.

Can you add attributes to POIs we already have?

Yes. Send us your list with whatever identifiers you use and we return it enriched with coordinates, categories, catchment attributes or administrative joins, keeping your keys intact.

Next step

Have a specific data requirement?

Tell us the geography, the fields and the cadence you need for poi data. You get a scoped plan, a sample and a fixed price before any work starts.